Windows App · Open Source
PerfOverlay
A lightweight, transparent Windows HUD for real-time system stats — live CPU, RAM, and per-GPU usage floating directly over your desktop.
Built with only OS-native APIs — no frameworks, no third-party dependencies — for near-zero resource overhead.
What's inside
Features
Matches Task Manager
Real-time CPU, RAM, and per-GPU usage read from the same performance counters Task Manager uses — the numbers always agree.
Multi-GPU Support
Each physical adapter shown separately by its real hardware name — integrated and discrete GPUs both tracked correctly.
Truly Transparent
No background box by default — just floating text over your desktop. An optional solid card mode is available too.
Flexible Layout
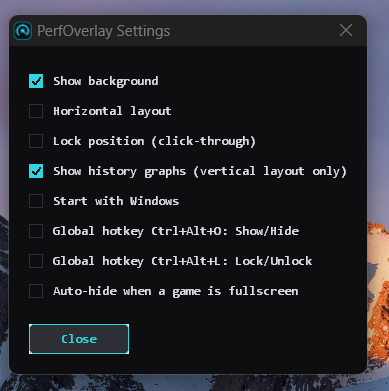
Switch between vertical (stacked) and horizontal (single-line) layouts at runtime — no restart needed.
History Sparklines
Optional per-metric history sparklines so you can spot spikes and trends at a glance, not just the current value.
Global Hotkeys
Show/hide and lock the overlay from anywhere with system-wide keyboard shortcuts.
Click-Through Lock
Lock mode makes the overlay click-through, and it auto-hides the moment a game goes fullscreen.
Native Settings & Tray
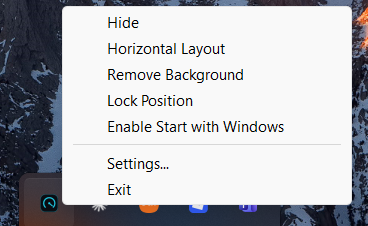
A native settings window and system-tray control — no external UI framework, no bloat.
Persisted Settings
Layout, position, and preferences are saved across restarts, along with optional auto-start with Windows.
In action
Screenshots
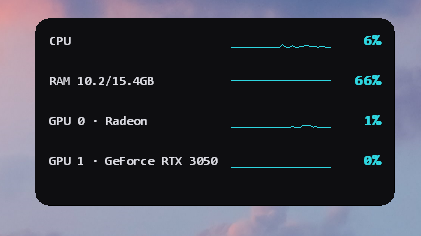

Vertical layout — with history sparklines
Under the hood
Technical Highlights
Built entirely on Win32, GDI, PDH, and DXGI — no third-party dependencies, no frameworks. Here's what went into getting the numbers right and the overhead near-zero.
Matching Task Manager's numbers
Found and fixed a ~15-point discrepancy by switching from the legacy % Processor Time counter to % Processor Utility — the one Task Manager actually displays — which accounts for CPU boost/throttle states.
Multi-vendor GPU support, no vendor SDKs
Enumerates physical adapters via DXGI for real names, then matches PDH's per-process GPU Engine counters back to each adapter by parsing the LUID embedded in the counter path — the same technique Task Manager itself uses, working identically across NVIDIA, AMD, and Intel.
Performance tuning
An early version rebuilt its GPU performance-counter query from scratch every second, costing ~8% CPU. Refactored to a persistent query with periodic (5s) instance rescanning, dropping CPU usage to ~0%.
True transparency
Uses color-key layered windows (LWA_COLORKEY) rather than alpha blending, so the background is genuinely see-through with crisp opaque text — and switched off ClearType in favor of plain antialiasing to avoid color fringing over arbitrary desktop content.
Zero truncation
Window width is computed at runtime from actual measured text (via GDI), so GPU names are never cut off regardless of length.
Footprint
~150KB
Executable
~0%
Idle CPU
15–20MB
RAM usage
0
Dependencies
Before you start
Requirements & Tech Stack
System Requirements
OS: Windows 10 or Windows 11
GPU: Any — NVIDIA, AMD, or Intel (integrated + discrete both supported)
Disk space: ~150 KB
Install: Portable single executable, no installer
Tech Stack
Single source file, zero third-party dependencies — built entirely on OS-native APIs for minimal footprint and maximum compatibility.
PerfOverlay is public domain
Released under the Unlicense — no attribution required, no restrictions. Read the code, fork it, ship it as part of your own project. PRs and issues are welcome.
View on GitHubWant to see your real numbers?
Free forever. No install wizard, no telemetry.
Windows 10 / 11 · Portable exe · No account required
Co-authored with Claude by Anthropic.